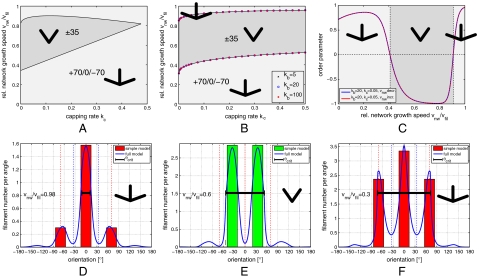
Figure 2.
Phase diagrams resulting from the rate equation approach. The dark and bright gray regions correspond to stability of the ± 35 and +70/0/-70 orientation patterns, respectively. (A) Analytical results from a linear stability analysis of the reduced model. (B) Numerical solution of the full model with three different branching rates kb = {5,20,100}. (C) Evolution of the order parameter with changing network velocity vnw from the numerical solution of the full model. The network behavior for increasing (red) and decreasing (blue) velocity are the same, thus the system is always in a stationary regime. (D, E, F) Comparison of the steady states of the analytically solved reduced model (bars) and the numerically solved full model (curves) for kb = 20 and kc = 0.05. Network bulk velocity vnw is decreasing from D to F: (D) vnw/vfil = 0.98, (E) vnw/vfil = 0.6, and (F) vnw/vfil = 0.3. The vertical red and blue dotted lines mark the prominent angles +70/0/-70 and ± 35, respectively. The horizontal solid black line marks the orientation range |θ| ≤ θc in which single filaments are not outgrown by the bulk network.

