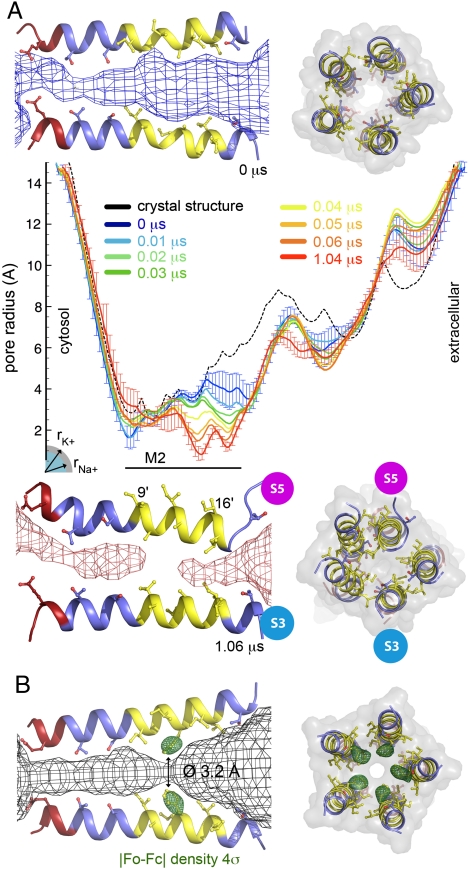
Fig. 2.
Pore radius. (A) Side and top views of GLIC M2 helices are shown for the start (Top) and end (Bottom) of the simulation; side chains facing the pore are depicted. Hydrophobic, polar, and negative residues are colored yellow, blue, and red, respectively. In the side view, only two subunits are shown, including the S5 subunit with a particular motion towards the channel axis resulting in partial unwinding at its top. The channel pathway is represented as a mesh. The central panel shows the pore radius along the channel axis for the GLIC crystal structure (Black, Broken Line) and for several stretches of the molecular dynamics simulation. The simulation results are averages over 20-ns windows, starting at 0.0, 0.01, 0.02, 0.03, 0.04, 0.05, 0.06 (blue to orange) and at 1.04 μs (red). Standard deviations are shown as error bars for the 0.0- and 1.04-μs windows. The radii of Na+ and K+ ions liganded in a protein environment are indicated. (B) Pore structure of the A13′F mutant, whose crystal structure was solved at 3.15 Å resolution. Same views as above with the density from initial Fourier difference maps contoured at 4σ represented as green mesh around the mutated A13′F position. The primed residue numbers are a common numbering scheme for all cys-loop receptors in the M2 helices, starting at its cytosolic end. GLIC’s V225 is V1′.

