
Table 2.
Ultrasound features of cystic or solid masses and ill-defined hypoechoic masses in the echo group versus MMG/PE group ultrasound features
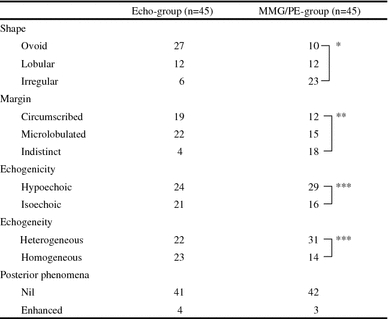
* P < 0.001, ** P < 0.01, *** P < 0.1
Official websites use .gov
A
.gov website belongs to an official
government organization in the United States.
Secure .gov websites use HTTPS
A lock (
) or https:// means you've safely
connected to the .gov website. Share sensitive
information only on official, secure websites.
Ultrasound features of cystic or solid masses and ill-defined hypoechoic masses in the echo group versus MMG/PE group ultrasound features
* P < 0.001, ** P < 0.01, *** P < 0.1