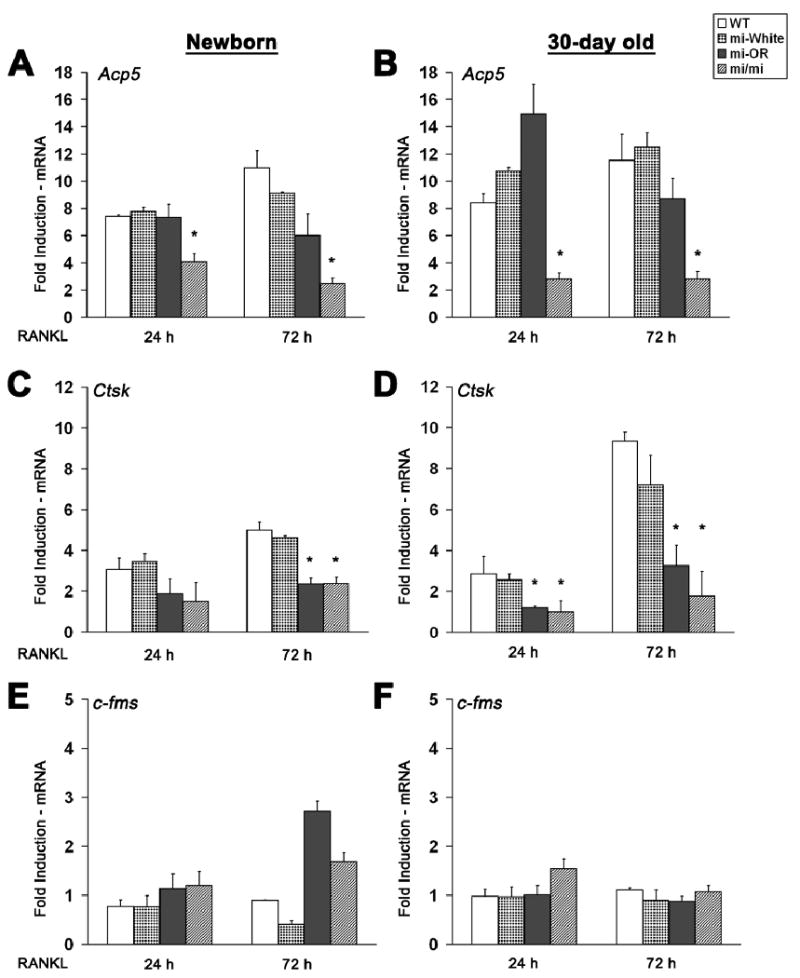
Figure 3. Mitfor/or osteoclasts express normal levels of Acp5 mRNA and significantly lower levels of Cathepsin K.

Average induction of Acp5 (A and D), Ctsk (B and E) and c-fms (C and F) mRNA levels in osteoclasts derived from newborn (left panels) or 30-day old (right panels) mice of indicated genotypes, at 24 or 72 hours in the presence of RANKL is shown. Average data (n=3), normalized to corresponding GAPDH and 18S mRNA levels, indicated as fold induction in the expression of each gene over CSF1 only treated (undifferentiated) controls, shown. Error bars indicate standard deviation and * indicates statistical significance (p<0.05, ANOVA).
