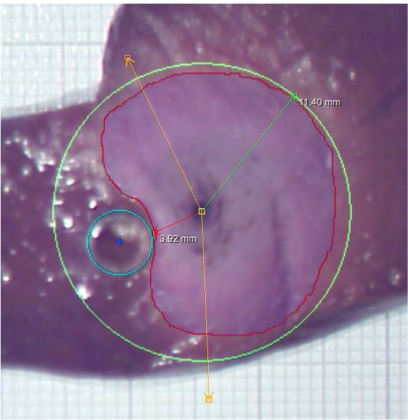
Fig. (10).
Result of an ex-vivo experiment with rves = 2.5mm and dap = 5mm . The red line is the manually drawn contour of the coagulation. The maximal radius of this contour, measured from the applicator’s center, is determined automatically, and a green circle with this radius is drawn. The cyan circle is the contour of the glass tube (also located manually). The amber lines specify a user-defined angle that is irrelevant for the results presented here.

