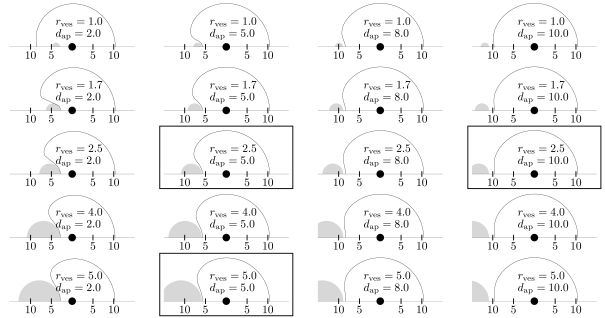
Fig. (7).
Plot of the necrosis (solid line) for selected values of the vessel radius rves and the applicator distance dap , as reconstructed from the look-up table, i. e. from the function . For reasons of symmetry, we only show the top half plane. For clarity, the corresponding vessel (gray) is also shown. Given quantities are in millimeters. An encasement occured in the top left case—the (very small) tube of unaffected tissue (thickness θtube = 0.05mm ) is not shown. Framed plots correspond to the ex-vivo experiments shown in Figs. (10-12).

