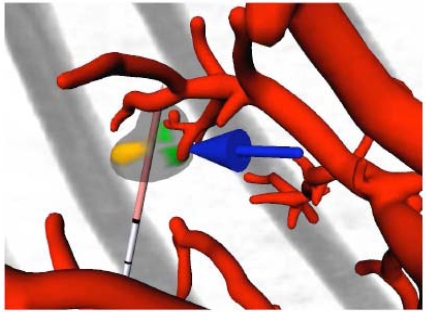
Fig. (9).
Screenshot of the interactive visualization tool, displaying the vessels (red), the applicator (gray and light red), and the original CT image (gray). A tumor is displayed as well, using three different colors: transparent gray for parts that will be destroyed, brown for parts that will possibly remain unaffected due to a too large distance from the applicator, and green for parts that will possibly remain unaffected due to the influence of blood vessels. A blue arrow points to the latter to catch the observer’s eye.

