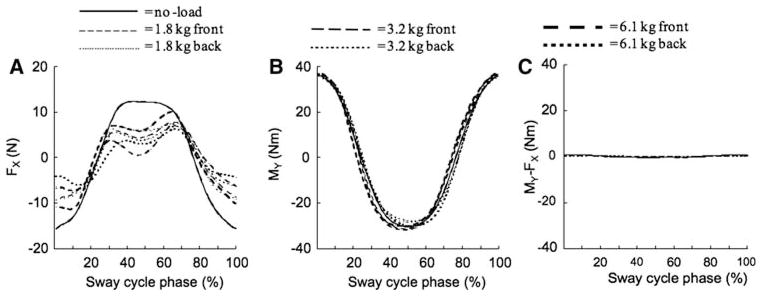
Fig. 4.
Time profiles of the shear force FX (left), moment of force around the frontal axis MY (middle), and moment of force around the frontal axis produced by FX (MY–FX, right) averaged across cycles for a typical subject for each of the loading conditions. Note the very small values of MY–FX, and the different time profiles of FX and MY. Also note the similar MY profiles across the conditions and the largest FX peak-to-peak excursion in the no-load condition

