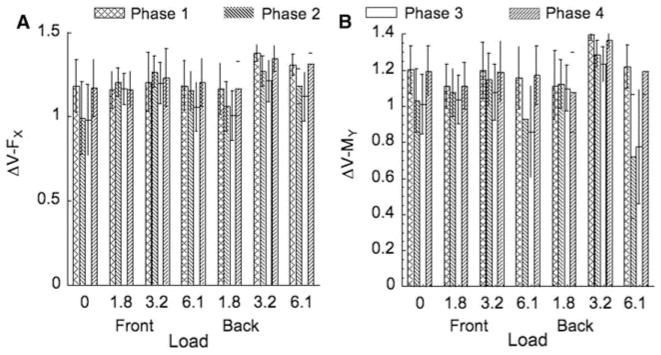
Fig. 7.
Synergy index ΔV for FX (left) and MY (right) for the seven loading conditions (F front, B back) averaged over subjects with standard error bars. The four columns for each condition refer to four phase intervals within the sway cycle: Phase 1 (0–5 and 95–100%), Phase 2 (20–30%), Phase 3 (45–55%), and Phase 4 (70–80%)

