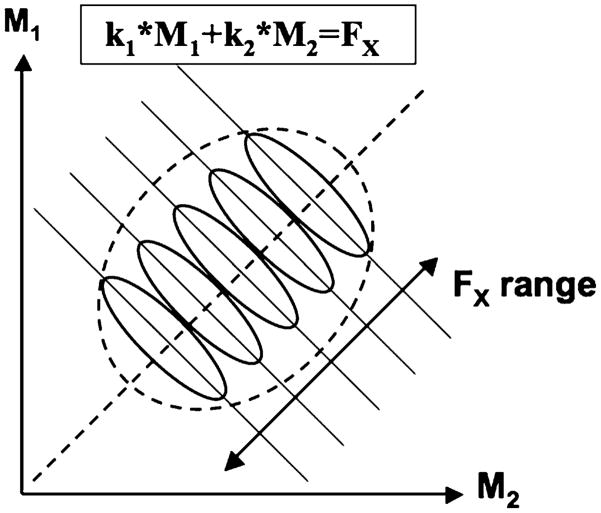
Fig. 8.
A schematic illustration of a performance variable stabilized by a two-M-mode synergy. A linear relation is assumed: FX = k1 * M1 + k2 * M2. The solid slanted lines illustrate UCMs for different values of the performance variable. The ellipses illustrate possible data point distributions across cycles assuming that FX is stabilized by a multi-M-mode synergy. The dashed slanted line corresponds to the orthogonal complement to the UCM. Note that linear regression analysis is only able to account for much of the FX variance if FX range is large

