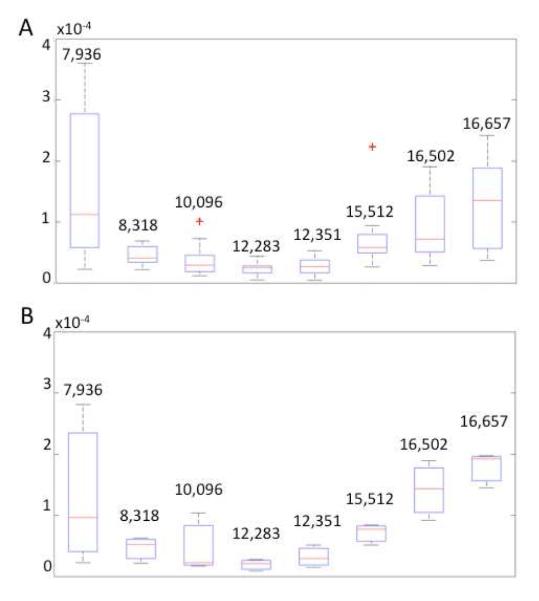
Figure 4.
Box-and-whisker plot statistical representation of peaks used by the SVM classifier. (A) Discrimination ability of the SVM peaks from the complete dataset including all available subjects, for all tumor grades; (B) Box-and-whisker plot of spectra from dataset for one randomly selected subject, for all tumor grades. Discrimination ability of the SVM peaks for a selected subject’s dataset including all tumor grades. The lower and upper quartiles in each box are delineated by the median represented by a red line; the smallest and largest observations are indicated by corresponding whiskers; red crosses outside the whiskers delimited regions report outliers.

