
Figure 2.
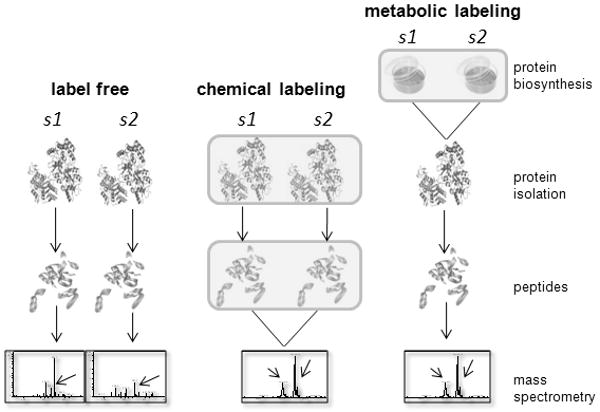
Current strategies for quantitative proteomics. In the label-free quantification approach, each sample (s1, etc.) is experimentally analyzed separately. The molecular information extracted from each sample is integrated during data analysis to obtain protein quantities (e.g., spectral counting or area under the curve calculation). Arrows in mass spectra denote differentially expressed peptides. With chemical labeling approaches, samples are labeled with various reagents either as proteins (typical for ICAT; upper box in middle panel) or as proteolytic peptides (as is typical with iTRAQ; lower box in middle panel), and mixed together prior to quantitative analysis by MS. Arrows in MS spectrum indicate an identical but differentially labeled peptide from s1 and s2. The different peak heights reflect differential levels of the parent protein. Metabolic labeling is possible with cultured cells that can incorporate labeled amino acids into proteins during growth in culture (box in right panel). Metabolically labeled samples are mixed together prior to protein isolation and further processed and analyzed by MDLC MS; quantification is again achieved via comparison of isotopically labeled peptides (as for chemical labeling approaches).