Figure 3.
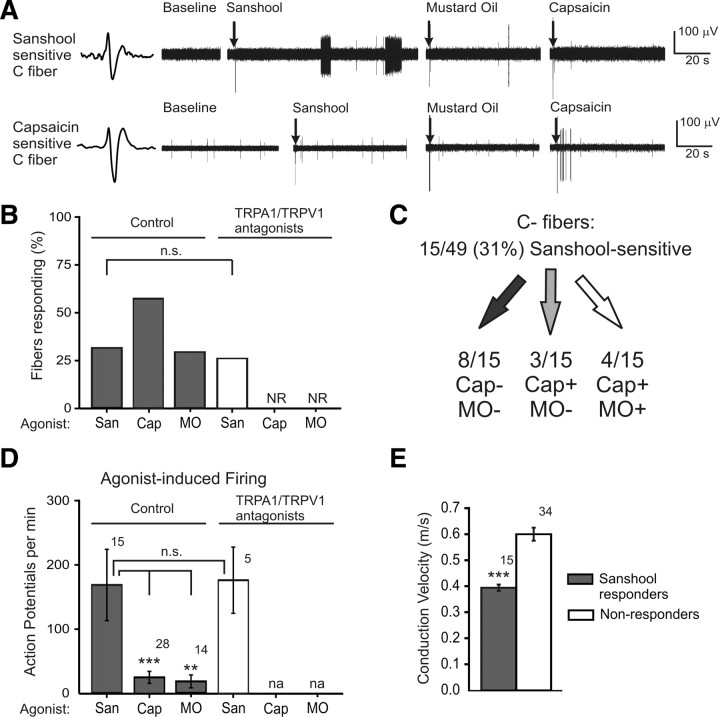
Sanshool activates a subset of C fibers. A, Representative C-fiber responses. Top trace, Example of a C fiber that was sensitive to hydroxy-α-sanshool (200 μm) but not to mustard oil (1 mm) or capsaicin (1 μm). Bottom trace, Example of a C fiber insensitive to sanshool and mustard oil but sensitive to capsaicin. B, Proportion of C fibers that respond to sanshool (San), mustard oil (MO), or capsaicin (Cap), in the presence or absence of TRPA1 and TRPV1 inhibitors (HC-030031 at 100 μm and A-425619 at 3 μm, respectively). Fisher's exact test, p = 0.42 for sanshool-sensitive fibers. C, Fraction of C fibers responsive to sanshool and their sensitivity to capsaicin and mustard oil (+ indicates sensitivity to the chemical agonist, whereas − indicates insensitivity; 5 of 32 fibers were insensitive to all chemical agonists). D, Action potentials fired per minute in response to sanshool, capsaicin, or mustard oil, in the presence or absence of TRPA1 and TRPV1 inhibitors. n.s. indicates no significant difference between groups (Student's t test; p = 0.40). **p < 0.01 and ***p < 0.001, significant difference between groups (one-way ANOVA, followed by a Tukey–Kramer post hoc test). E, Conduction velocities of all C fibers that were sanshool sensitive (gray) or insensitive (white). Conduction velocities were measured before sanshool stimulation and are therefore an inherent property of the C fiber. ***p < 0.01, significant difference between sanshool-sensitive and -insensitive fibers (Student's t test).

