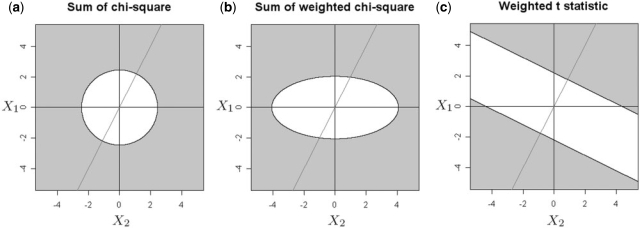
Fig. 1.
Comparison of the null hypothesis rejection regions between the SC statistic (8) (a), the weighted SC statistic (9) (b) and the weighted t-statistic (5) (c) on K = 2 platforms. In all figures, the axes are the magnitudes of the X variables (6) for platforms 1 and 2. A significance level of 0.05 is used to determine the decision boundaries of all three statistics. For (b) and (c), weights of δ1 = 1, δ2 = 2 are used. The oblique line shows the direction of the weight vector δ = (δ1, δ2).

