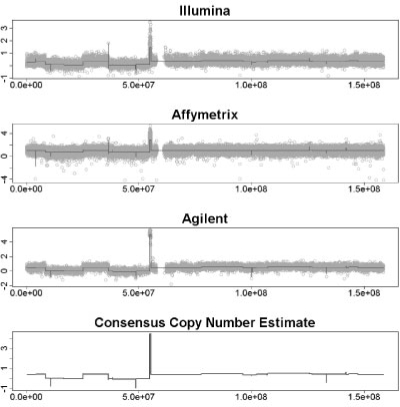
Fig. 5.
Result of MPCBS on a TCGA sample. The top three plots show Illumina, Affymetrix, and Agilent data with CBS fit. Bottom panel shows multi-platform consensus. For all plots, the horizontal axis is probe location in base pairs, and the vertical axis is the data intensity for the given platform or the consensus intensity estimate θ in the case of MPCBS.

