Fig. 2.
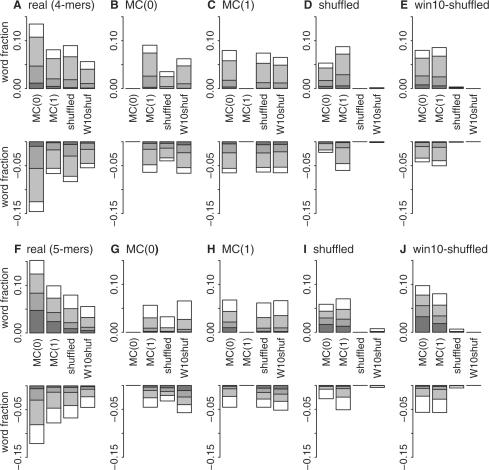
Over/underabundance of real Pfam-AB and synthetic words versus random models. Alternate estimates of exceptional four-letter (A–E) and five-letter (F–J) word clump counts from q-value analysis of Pfam-AB-seg Real (A, F), MC(0) (B, G), MC(1) (C, H), shuffled (D, I) and win10-shuffled (E, J) libraries based on four random models: MC(0), MC(1), shuffled and win10-shuffled (W10shuf) are shown. Overrepresented words are shown as positive fractions; underrepresented words are negative fractions. Shading denotes the magnitude of the over- or underrepresentation with respect to the corresponding random model; dark gray, >2.0 (1up2) or <0.5 (1dn2); gray, >1.5 (1up3) or <0.67 (1dn3); light gray, >1.25 (1up5) or <0.8 (1dn5); and white, exceptional words between 0.8- and 1.25-fold of the expected value.

