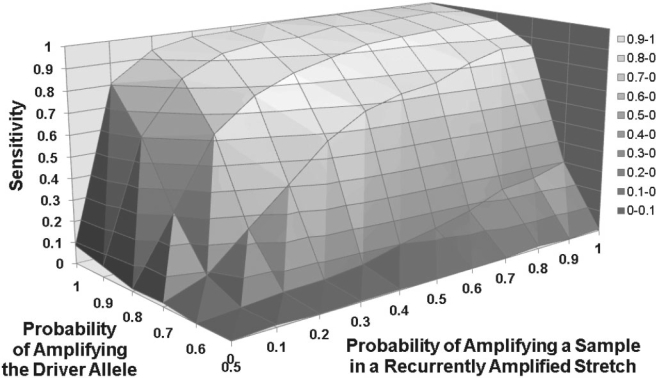
Fig. 2.
Sensitivity across value combinations of two parameters. Dataset B: 698 Samples. The two parameters are denoted on the z- and x-axes and have the ability to significantly affect sensitivity of ADT. This graph is produced from performing simulations on the 698 sample Affymetrix 250K dataset. Sensitivity jumps when the sample amplification parameter reaches 0.1 but tapers afterwards. Sensitivity also increases when the driver allele amplification parameter reaches 0.7. Sensitivity at the default parameter values (0.2 for sample amplification and 0.9 for driver allele amplification) reaches 0.84. Considering the default parameter values represent properties seen in real data, this indicates that ADT will perform well on real datasets with large sample sizes.

