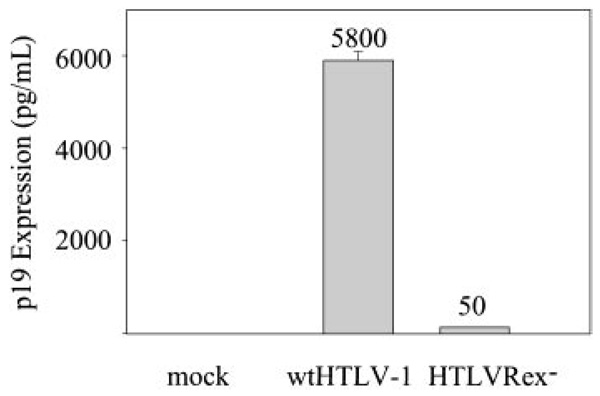
Figure 2. p19 Gag expression in 293T cells.
2 × 10⁵ 293T cells were transfected with 5 µg of wtHTLV-1, HTLVRex−, or expression vector control DNA . At 72 hours after transfection, p19 Gag production was measured in the supernatant by ELISA. The values, which represent p19 Gag levels for 3 independent experiments, are normalized for transfection efficiency. Error bars indicate standard deviations. The data indicate detectable Gag production in the absence of Rex.

