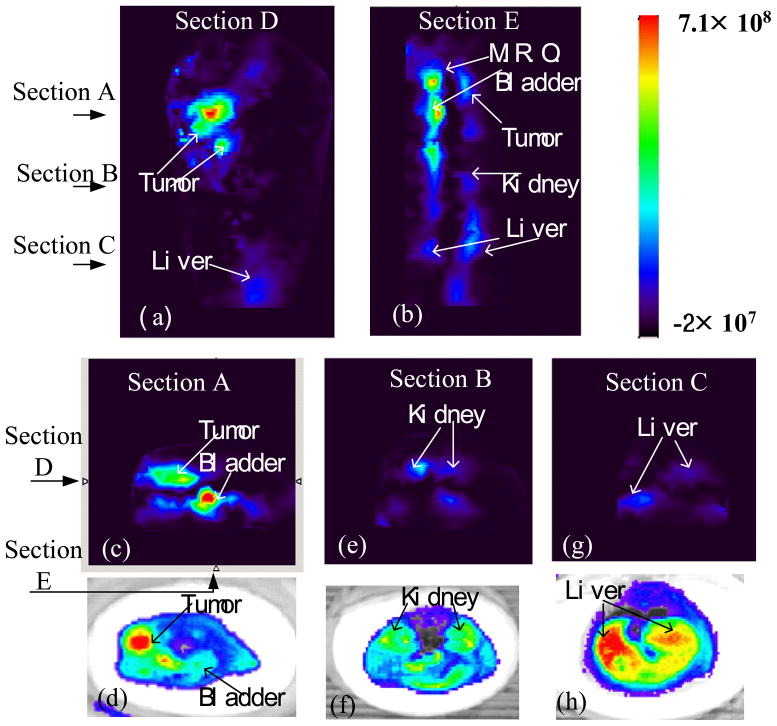
Fig. 13.
Reconstructed 3D fluorescence optical image of the mouse 24 hours after 2DG injection. (a) Coronal section; (b) sagittal section; transverse section at A cross the tumor and bladder (c), at B across the kidney (e) and at C across the liver (g); fluorescence image of mouse cryosection corresponding to section A (d), section B (f) and section C (g). MRO indicates “male reproductive organ”. The color bar indicates the reconstructed fluorescence dye concentration at arbitrary unit.

