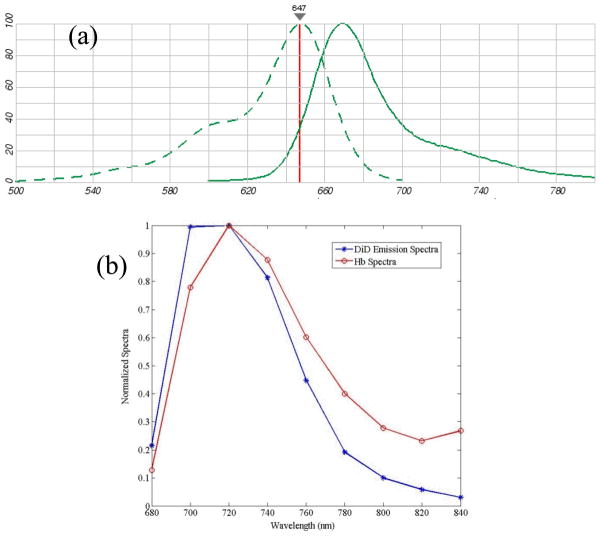
Fig. 7.
(a) The excitation (dotted line) and emission (solid line) spectra of DiD dye from Invitrogen SpectraViewer, where horizontal axis indicates the wavelength with unit nm. (b) The normalized emission spectra of DiD dye solution (blue) and deoxyhemoglobin (red) measured with the imaging system and 650 nm excitation.

