
Fig. 6.
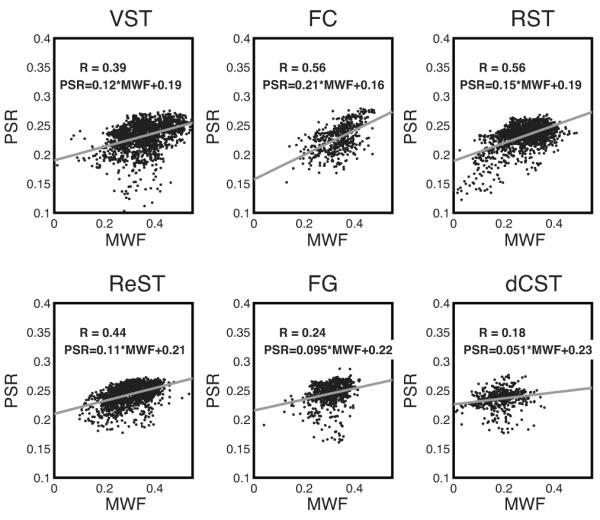
Scatter plots of PSR vs MWF for all WM tract voxels from all six spinal cord samples, presented by WM tract. In each frame is shown the best fit linear function and correlation coefficient. In all cases, linear correlations were highly significant (p << 0.01) owing to the large number of data point (≈ 1000).