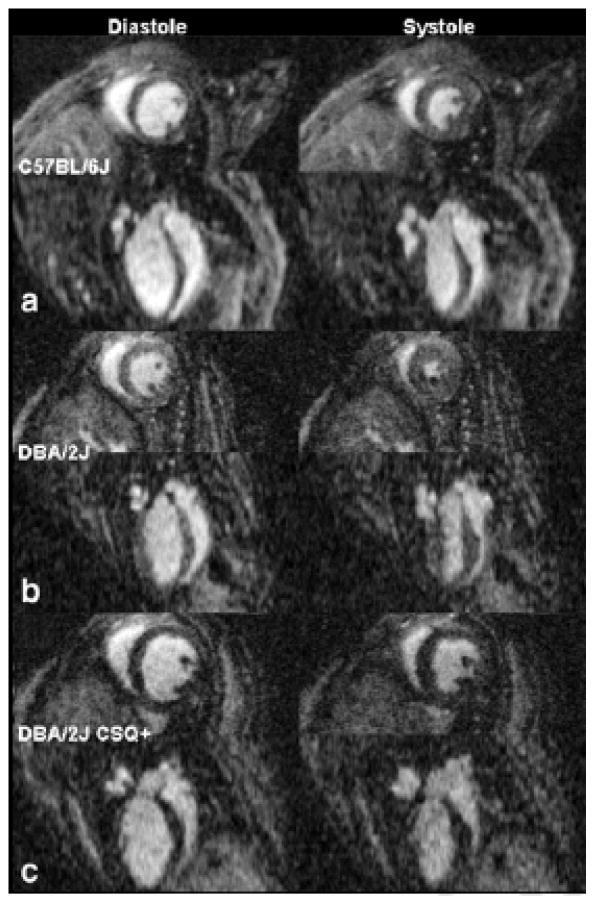
Figure 2.
The short and long axis left ventricular view for both diastole and systole are displayed for one of the six C57BL/6J mice (A), a DBA/2J mouse (B), and a DBA/2J CSQ+ mouse (C), which is a genetically modified mouse model of heart failure. In all three cases, the short axis view is on top and immediately below is the long axis image. The images on the left show diastole and the images on the right show systole.

