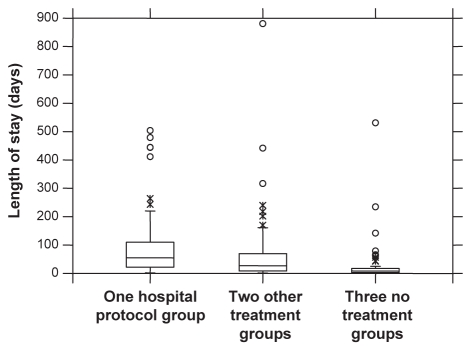
Figure 1).
Box and whiskers plot of the length of stay according to treatment. In all three groups, the distribution has a long right tail (ie, short stays dominate, while some very long stays push up the average). The hospital protocol group showed longer stays followed by the other treatment group and then the no treatment group

