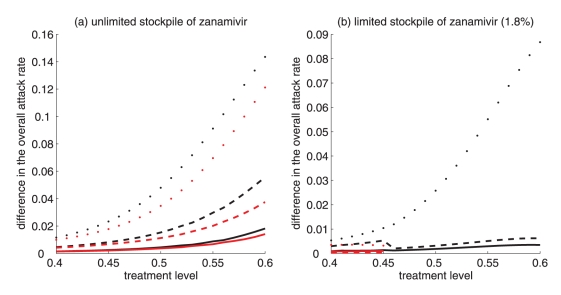
Figure 5.
Difference between the largest attack rate when the switch to zanamivir occurs at a different time (earlier or later than the optimal switch-time) and the minimum attack rate (obtained at the optimal switch-time) for: (a) unlimited, and (b) limited (1.8%) stockpile of zanamivir. Solid curves illustrate the difference in attack rates when switch occurs within 15 days earlier (red curve) and later (black curve) than the optimal switch-time. Dashed curves illustrate the difference in attack rates when the switch occurs within 30 days earlier (red curve) and later (black curve) than the optimal switch-time. Dotted curves show the difference in attack rates when the switch occurs any time before (red curve) and after (black curve) the optimal switch-time.

