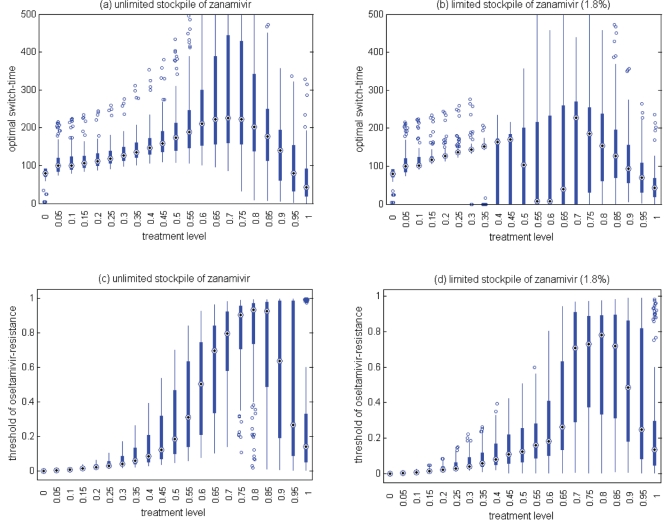
Figure 6).
Sensitivity analyses for the variation in the optimal switch time (days) with different treatment levels and R0=1.6 for (a) unlimited and (b) limited (1.8%) stockpiles of zanamivir. Sensitivity analyses for the variation in the ratio of the cumulative number of oseltamivir resistance to the total infections with different treatment levels and R0=1.6 for (c) unlimited and (d) limited (1.8%) stockpiles of zanamivir. The ranges of other parameter values used for these simulations are given in Table 1. For a given treatment level, the circle with a dot at the centre is the median of the optimal switch time, the wide bars show the extent of the interquartile range, the lines represent the extent of data points that are not outlying and the empty circles indicate outliers

