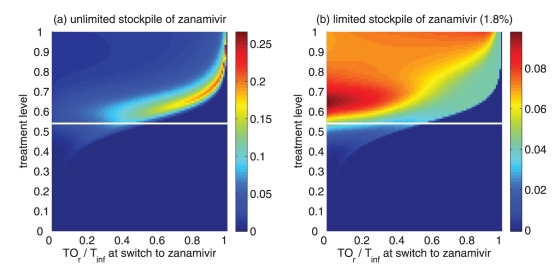
Figure 6.
Reduction in the overall attack rate with two drugs versus a single drug for: (a) unlimited, and (b) limited (1.8%) stockpile of zanamivir. The horizontal axis shows the ratio of the cumulative number of oseltamivir-resistance (TOr) to the total number of infections (Tinf), when the switch to zanamivir occurs for different treatment levels displayed on the vertical axis. The solid (white) line corresponds to 54% treatment level (fc) at which the overall attack rate is minimized for a single drug (oseltamivir).

