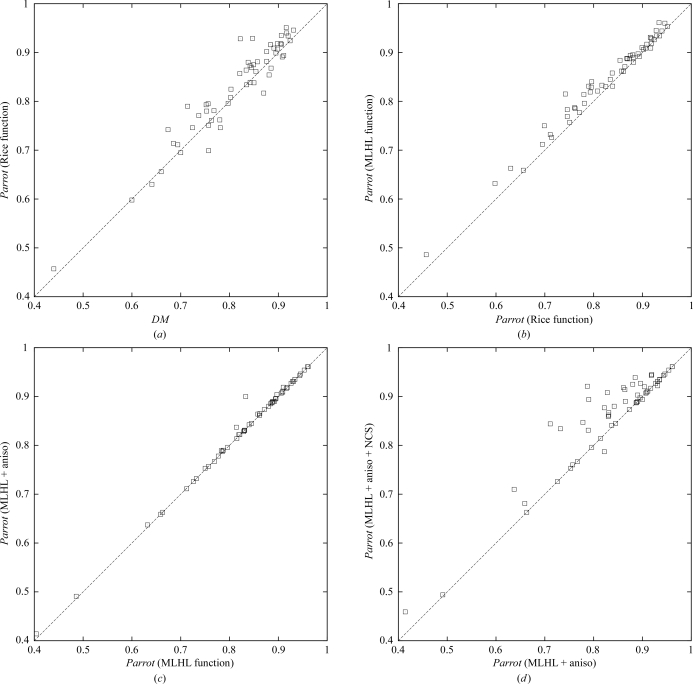
Figure 2.
Mean map correlation calculated of a range of JCSG data sets with using different density-modification programs and options. (a) Parrot with no new features compared with DM. (b) Parrot with MLHL likelihood function compared with the Rice function. (c) As (b), with anisotropy correction compared with no anisotropy correction. (d) As (c), with automated NCS averaging compared with no NCS averaging.

