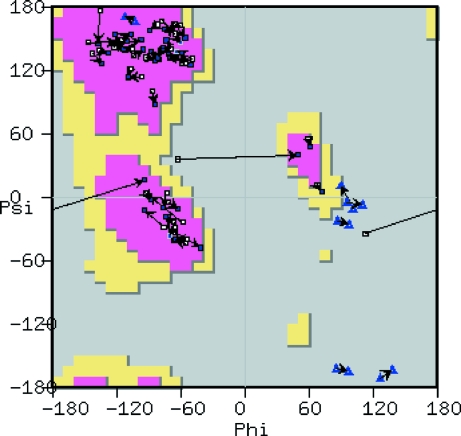
Figure 9.
Screenshot of a Kleywegt plot (Kleywegt, 1996 ▶) showing Ramachandran differences between two NCS-related chains by connecting lines (angles in degrees). Labels, colouring and symbols are as in the previous figure. Arrows link NCS-related residues.

