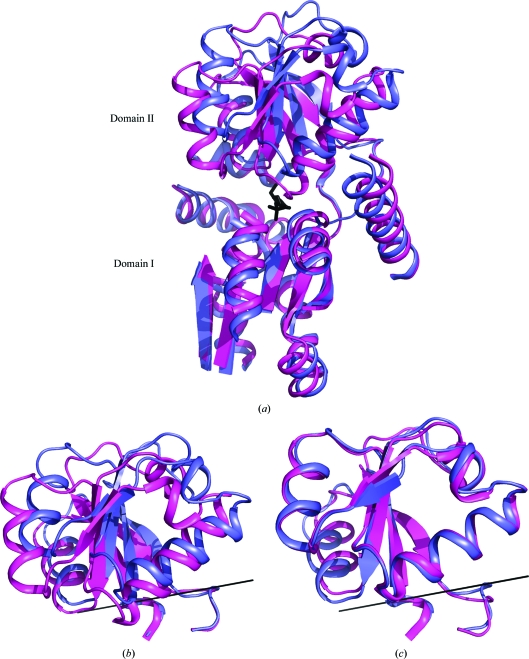
Figure 3.
(a) Ribbon representation of the superimposed SsuAs from E. coli (blue) and X. axonopodis pv. citri (magenta). The HEPES molecule is shown as black sticks. The loops from domain I have been truncated for visualization. (b) Close-up view of the superimposed domains II. The rotation axis is shown as a solid black line. (c) Superimposition of the two domains from (b) along the rotation axis. They superimpose with an r.m.s.d. of 0.96 Å.

