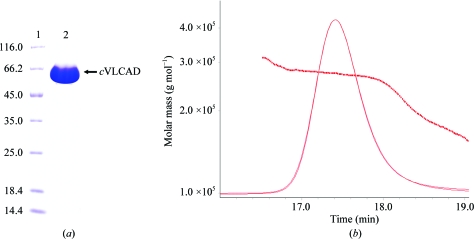
Figure 1.
(a) SDS–PAGE of purified cVLCAD. Lane 1, protein molecular-weight markers (Fermentas; labelled in kDa); lane 2, purified cVLCAD. SDS–PAGE was performed on a 12%(w/v) gel; the gel was stained using Coomassie Brilliant Blue. (b) The profile of the SEC-LS/UV/RI experiment. The parameters monitored by the light-scattering (LS) and refractive-index (RI) detectors are plotted as curves and the molecular weights calculated according to LS and RI measurements at each time point are plotted as dots.

