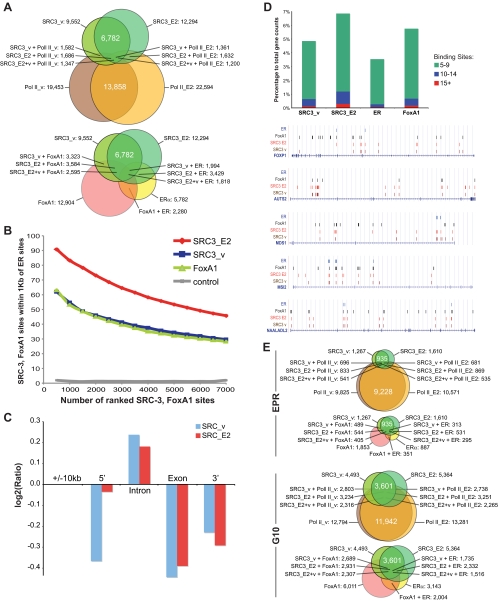
Figure 1.
Genome-wide MCF-7 cartographies of SRC-3, RNA Pol II, and comparative location analyses with recalculated global maps of ER and FoxA1 binding sites. High-confidence ChIP sites for SRC-3 and RNA Pol II in vehicle (SRC3_v, Tx_v) and 1 h E2-treated MCF-7 cells (SRC3_E2, Tx_E2), ER, and HNF3A (FoxA1). BED files containing chromosome annotation and start-stop positions of the ChIP sites are provided as Supplemental Material SM1. A, ChIP binding site counts and proximity relationships. Venn illustrations of binding sites with sequence centers within 1 kb of each other for SRC-3 and RNA Pol II (top) and for SRC-3, ER, and FoxA1 (bottom). B, Proximity distribution of SRC-3, FoxA1, and ER binding sites. The x-axis represents numbers of SRC-3 and FoxA1 binding sites ranked by P values and binned at 500, and the y-axis represents percentage of SRC-3 and FoxA1 sites that are within 1 kb of ER binding sites. Random selected 7000 regions on the arrays were used as control. Approximately 10% of SRC-3 ChIP-Seq platform-specific sequences have been removed to allow for a fair cross-platform comparison. A reciprocal proximity distribution of ER binding sites compared with SRC-3 sites is provided in Supplemental Material SM2. C, Intragenic SRC-3 sites are overrepresented in intronic sequences. Log2 values are shown for ratios of expected numbers of SRC-3 sites over actual counts for the 10-kb gene-flanking regions (5′, 3′) and for intron and exon sequences. Binding site counts were normalized for the average length of total exon and intron sequences (8 × 316 bp and 7 × 5747 bp, respectively) according to the RefSeq model gene. D, Genome-wide intragenic SRC-3, FoxA1, and ER binding site frequency distribution; top, stacked columns representation of gene counts that have five to nine, 10–14, and 15 or more respective binding sites in the gene-transcribed region; bottom, UCSC Genome Browser illustrations of select genes showing array-type distributions of SRC-3 and FoxA1 binding sites. Sequence positions and other generic UCSC annotations were removed for clarity. E, Gene counts. Venn illustrations for genes with SRC-3 and RNA Pol II, and with SRC-3, ER, and FoxA1 binding sites in the EPR (−7.5 to +2.5 kb of TSS), and in the gene-transcribed regions ±10 kb (G10). The diagrams in A and E were drawn proportionally.

