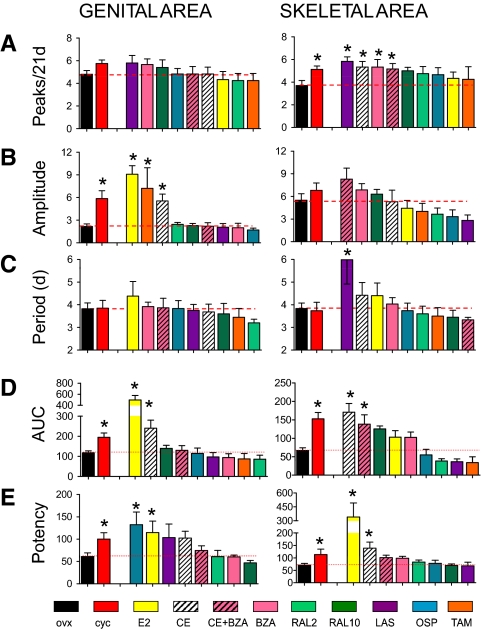
Figure 2.
Comparative analysis of the effect of treatment with selected SERMs on luciferase accumulation in skeletal and genital areas of ERE-Luc OVX mice. A–D, OVX females ERE-Luc mice were treated daily with 6 μg/kg sc E2, 3 mg/kg per os CE, 10 mg/kg per os BZA, 50 μg/kg sc LAS, 2 mg/kg sc OSP, 2 or 10 mg/kg per os RAL, or 0.8 mg/kg per os TAM. Photon emission measured in individual ERE-Luc mice was plotted against time (21 d). Bars represent the mean ± sem of a minimum of five animals per group. A, Peak number. Data were scored from the second-derivative plot using GraphPad Prism. On the basis of the variability of photon counting (coefficient of variation 12%), peaks less than the 15% of the distance between the minimum and the maximum are ignored [*, cycling (cyc) P = 0.023; LAS P = 0.004; CE P = 0.021; BZA P = 0.036; BZA+CE P = 0.028]. B, Peak amplitude. Photon emission was centered on the y-axis by the first derivative, and photon emission rates were then processed by fast Fourier transformation into its component sine waves with a 64 zero padding. Analyzed spectra were windowed at bins 3 and 10. The amplitude, estimating the degree of displacement from the resting state, was calculated as the square root of the 95th percentile of the power spectra (*, cyc P = 0.002; E2 P = 0.001; TAM P = 0.011; CE P = 0.003). C, Peak period. Periodicity is estimated by the inverse of the frequencies under the amplitude previously calculated (*, LAS P = 0.019). D, AUC. The AUC of the plot of photon emission in the 21 d treatment was calculated using GraphPad Prism by a trapezoidal approximation (*, genital area cyc P = 0.012, E2 P = 0.001, and CE P = 0.004; skeletal area cyc P = 0.001, E2 P = 0.001, and BZA P = 0.002). E, Groups of six ERE-Luc OVX mice were treated as in A, and photon emission in individual areas was measured 6 h after drug administration (*, genital area cyc P = 0.021, OSP P = 0.038, and E2 P = 0.017; skeletal area cyc P = 0.020, E2 P = 0.008, and CE P = 0.013). Bars represent mean ± sem (n = 6). Statistical analysis was done with ANOVA followed by Bonferroni comparing the effect of each experimental group with OVX and cycling mice.

