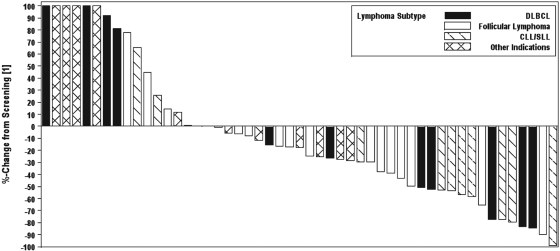
Figure 2.
Waterfall plot of best responses in evaluable patients observed by cohort in the phase 2 study. Six subjects had greater than 100% increase in size of lesions; these values are listed at 100% for display purposes. Seventeen patients are not included because of early termination of drug because of toxicity or disease progression and no formal postscreening assessment.

