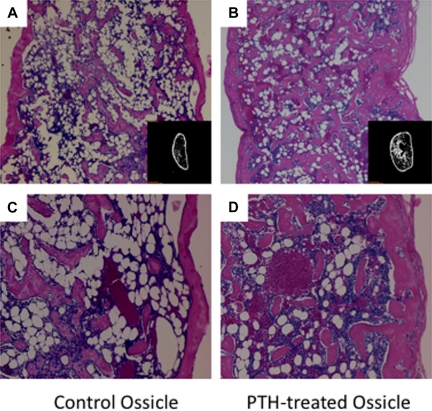
Figure 1.
Low- and high-magnification images of H&E-stained ossicle sections and micro-CT images (inset image). PTH-treated ossicles contained a higher density of trabecular bone and bone marrow cells. (A) Ossicle in control group without PTH treatment (×40). (B) Ossicle in PTH-treated group (×40). (C) Ossicle in control group (×100). (D) Ossicle in PTH-treated group (×100).

