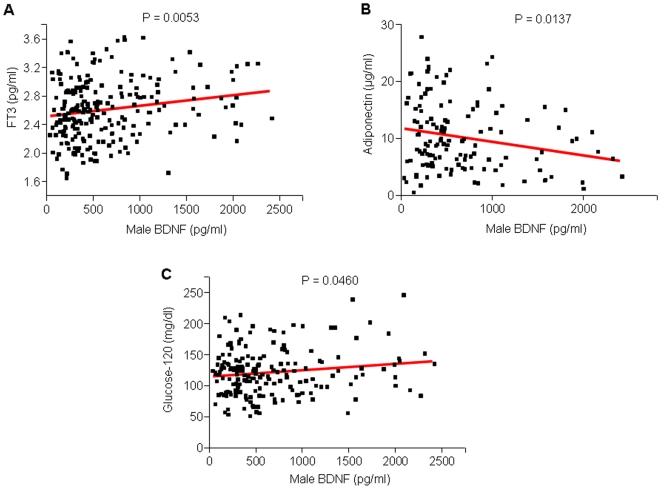
Figure 5. Linear regression analysis correlating plasma BDNF with thyroid function, adiponectin levels and glucose sensitivity in males.
A and C. Plasma BDNF was positively correlated with FT3 (p = 0.0053, R2 = 0.03348) and glucose-120 (p = 0.0460, R2 = 0.02170). B. Plasma BDNF was inversely correlated with plasma adiponectin (p = 0.0137, R2 = 0.04650).

