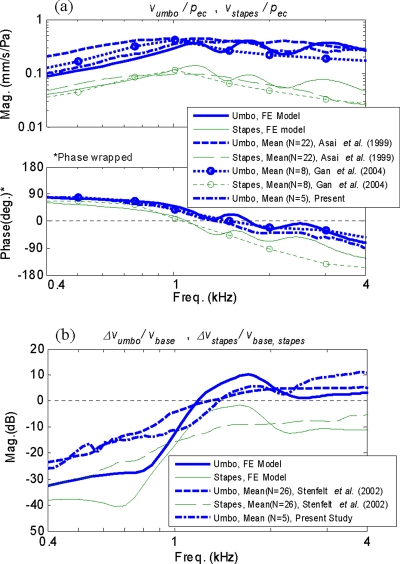
Figure 8.
Comparison of the FE-simulated AC and BC responses with published mean temporal bone data (Asai et al., 1999; Gan et al., 2004; Stenfelt et al., 2002): (a) AC responses at umbo and stapes (magnitude and phase); (b) BC responses at umbo and stapes (magnitude only). Measured mean umbo response data (N=5) from the present study are also shown.

