
Figure 2.
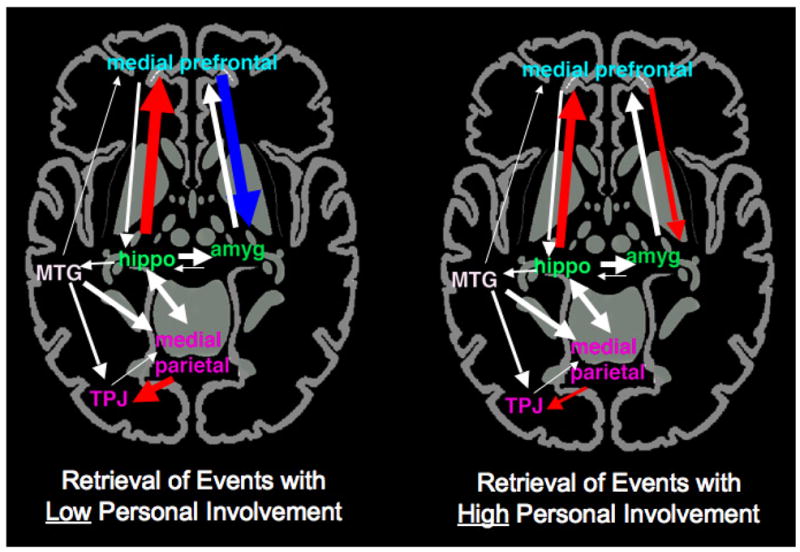
A schematic representation of how the effective connectivity within an autobiographical retrieval network varies based on the level of personal involvement with a past event. Colored lines indicate conditions that differ significantly between the two types of events, with red lines indicating significantly positive connections and blue lines indicating significantly negative connections. Connections which did not differ between the conditions are depicted in white. The thickness of the line represents the strength of the connection. Adapted from Muscatell et al. (in press). Hippo = hippocampus; Amyg = amygdala; TPJ = temporo-parietal junction; MTG = middle temporal gyrus. Region names are color-coded to match those depicted in Figure 1.