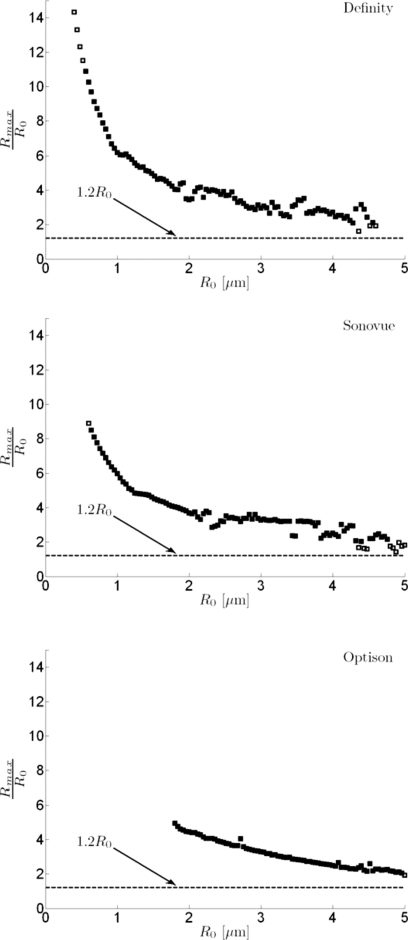
Figure 4.
Postexcitation responses predicted with the model relative to maximum radial expansion Rmax and break-up radius (Rbreak-up=1.2R0). Radius-time and pressure-time responses were simulated for each microbubble type as a function of the initial microbubble radius R0 (ΔR0=20 nm) for a 2.8 MHz, 5-cycle incident pulse with PRPA of 2 MPa. The value of Rmax on each radius-time curve divided by the initial radius (Rmax∕R0) is plotted as a function of R0 for each microbubble type. Cases for which the associated pressure-time response exhibited a postexcitation signal are plotted as filled symbols, and cases with no postexcitation signal are plotted as open symbols. For display, every other data point is plotted (steps of 40 nm). Simulated responses for large microbubbles presenting Rmax∕R0 just above the shell break-up threshold, but below a value of two do not present postexcitation signals.

