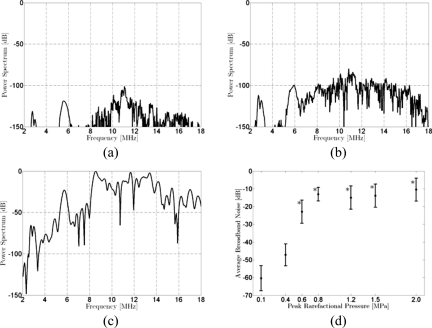
Figure 5.
Simulated spectral responses for a Definity microbubble at resonance radius (R0=2.14 μm) with a break-up radius Rbreak-up=1.2R0. Incident pulse at 2.8 MHz with 5 cycles. All spectra are presented with spectral amplitude relative to the peak value of the spectrum calculated for the response to the incident 2 MPa PRPA pulse. Incident PRPA: (a) 100 kPa, (b) 400 kPa, and (c) 2 MPa. (d) The average broadband noise (9.3–17.6 MHz) as a function of peak rarefactional pressure in the incident pulse. Error bars represent the standard deviation in the bandwidth. Stars indicate at which PRPA levels postexcitation emissions were identified on the simulated pressure-time curves.

