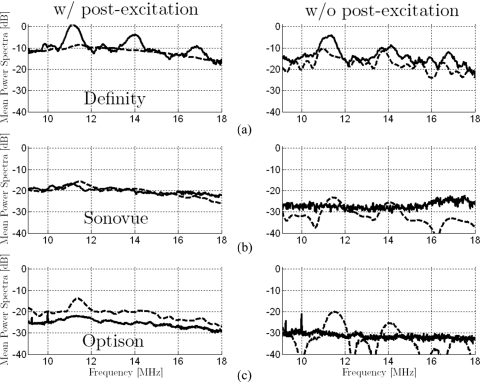
Figure 6.
Comparison of average spectra from signals with and without postexcitation response for simulated (dashed lines) and experimental (solid lines) results for (a) Definity, (b) Sonovue, and (c) Optison (incident peak rarefactional pressure amplitude of 2.0 MPa). All experimentally estimated spectra are presented on the same scale relative (re: 0 dB) to the peak value for Definity with postexcitation signals. The scaling factor that provided best alignment between simulated and experimental curves for Definity with postexcitation signals was calculated. This uniform off-set was applied to all simulated spectra. Highest broadband noise levels are observed for Definity and lowest levels for Optison. For each microbubble type, the average spectrum is higher for the case with postexcitation response than for the case without postexcitation response. Overall, the amplitudes of the simulated spectra vary consistently with the amplitudes of the experimentally assessed spectra (similar differences between microbubble types and between cases with and without postexcitation signals).

