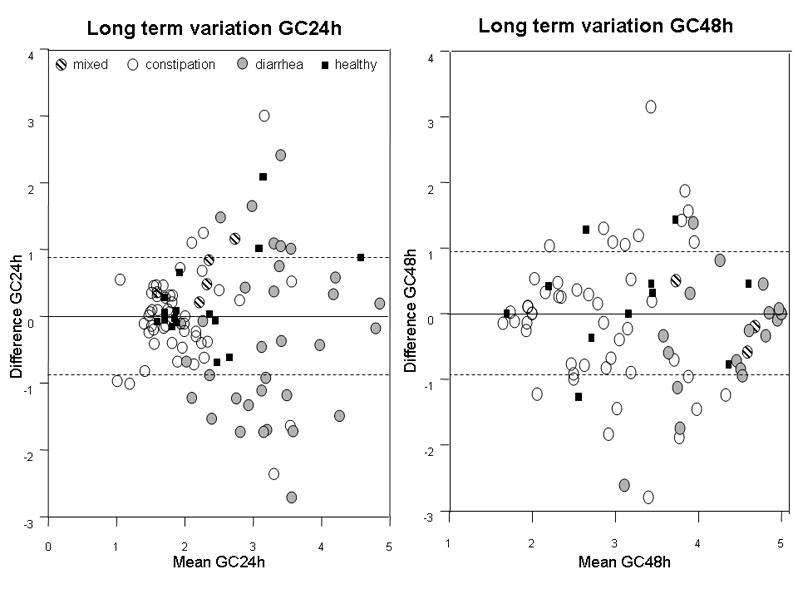
Figure 2.

Bland-Altman plots showing long-term intra-subject variation of colonic transit at 24h and 48h for participants in different subgroups. Plot shows 1 standard deviation as the interrupted lines. Note most data are well within 1 SD which is ~0.9 GC units (y axis). Note that the greatest variation occurs in IBS patients with diarrhea and the variation is greater at 24h than at 48 h.
