
Figure 3.
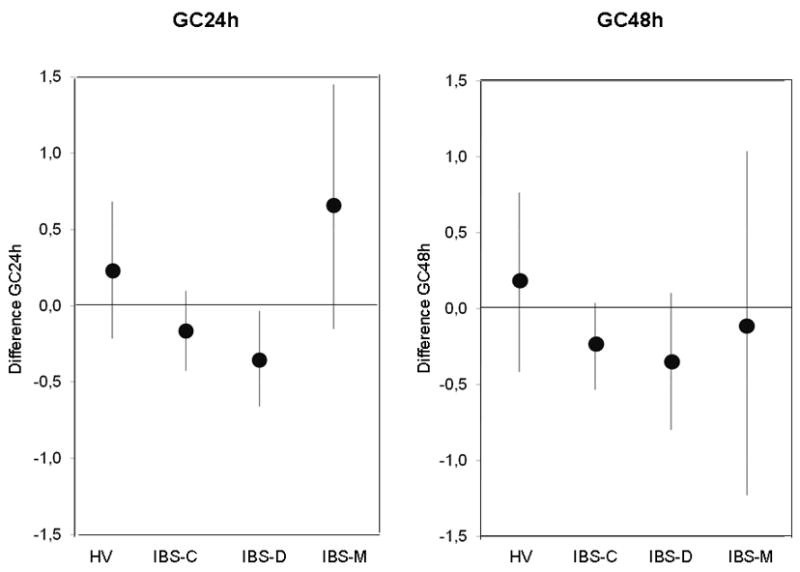
Change in geometric center in different subgroups expressed as means and 95% confidence intervals. Note that the 95% confidence interval for IBS-D subgroup does not cross the zero line, indicating a significant difference in colonic transit for the IBS-D subgroup, but not for the other groups.