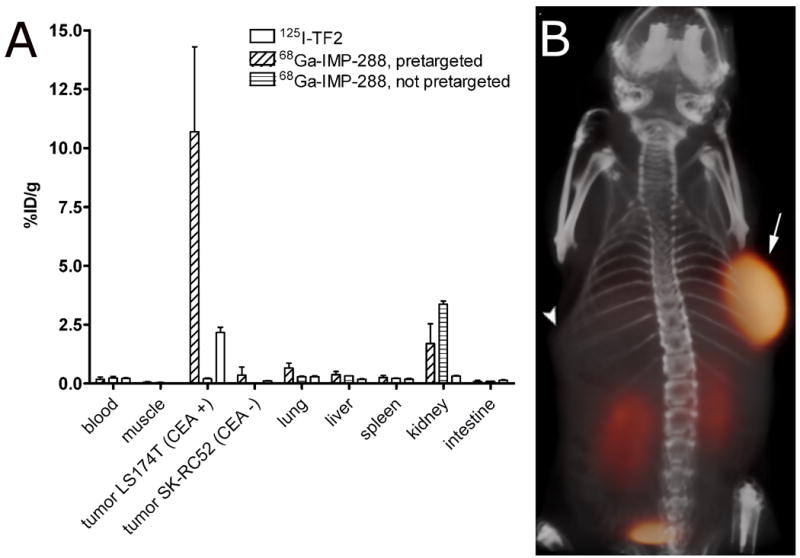
Figure 3.

Biodistribution of 6.0 nmol 125I-TF2 (0.37 MBq) and 0.25 nmol 68Ga-IMP-288 (5 MBq), 1 h after i.v. injection of 68Ga-IMP-288 in BALB/c nude mice with a subcutaneous LS174T and SK-RC52 tumor. Values are given as means ± standard deviation (n=5) (A). 3D volume rendering of PET/CT image of a BALB/c nude mouse with a subcutaneous LS174T CEA-expressing tumor in the right flank (arrow) and a subcutaneous SK-RC 52 tumor, a non-CEA-producing, tumor in the left flank (arrowhead), that received 6.0 nmol TF2 and 5 MBq 68Ga-IMP-288 (0.25 nmol) intravenously with a 16-hour interval, imaged one hour after 68Ga-IMP-288 injection (B).
