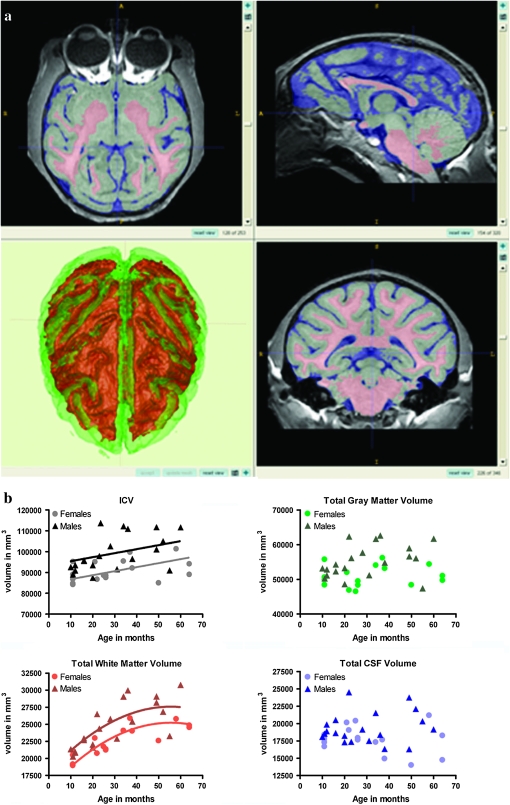
Figure 1.
Results of the tissue classification. (a) Tissue segmentation overlaid on the smoothed, intensity corrected image of a representative case. GM in green; WM in red; cerebrospinal fluid in blue. (b) Development of ICV and major tissue classes shown as scatter plots of volume in mm3 by age in months. When there was no evidence of a significant effect of age on estimation of brain volume, no regression line was fitted.

