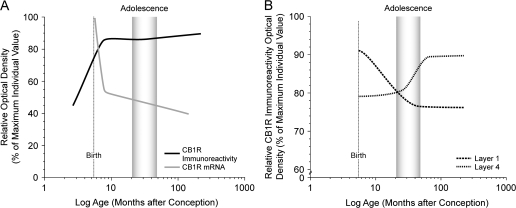
Figure 8.
Schematic summary Figures illustrating trajectories of overall CB1R immunoreactivity and mRNA levels (A) and density of CB1R-IR axons in layers 1 and 4 (B) across development. Lines were generated by plotting the density as a percent of the maximum density value for individual animals for each marker as a function of age in months after conception on a log scale, fitted by Loess regression analysis, and smoothed by hand. The shaded area indicates the approximate age range corresponding to adolescence (15–42 months; Plant 1988) in macaque monkey. Note the different developmental time courses in overall CB1R immunoreactivity and mRNA levels (A) and in the laminar distribution of CB1R immunoreactivity (B).

