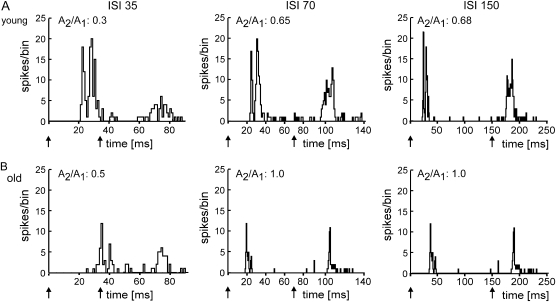
Figure 1.
Examples of PSTHs (A and B). PSTHs of the neuronal responses after tactile paired-pulse stimulation with different ISIs. Stimulus duration was 8 ms. The number of spikes/bin (bin width = 1 ms) is plotted against time. Arrows indicate onset of tactile stimulation. Additionally, the ratio calculated for the amplitudes of the second and first response peaks is shown for each single PSTH. (A) PSTHs of neuron responses recorded in a young animal. (B) PSTHs of neuron responses recorded in an old animal.

