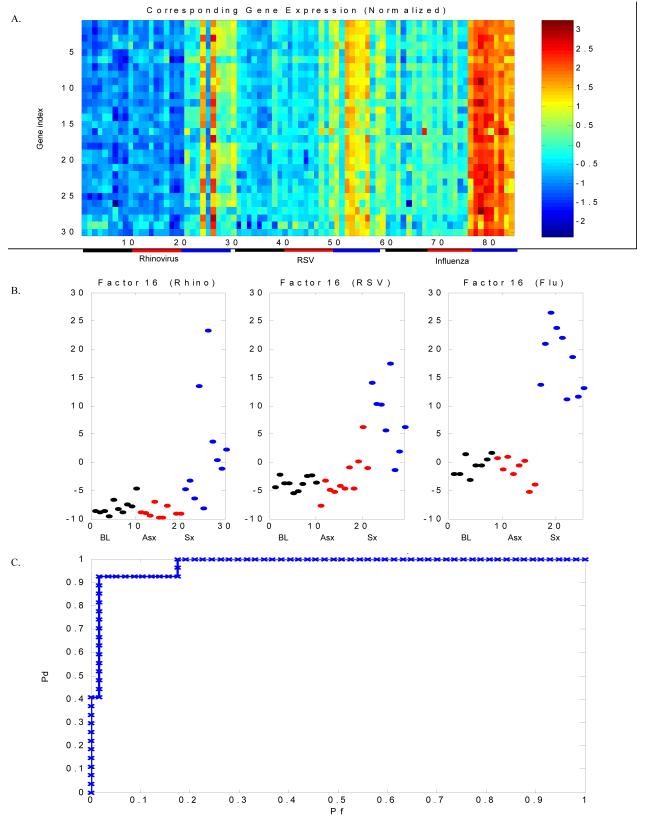
Figure 2. An acute respiratory viral gene expression signature characterizes symptomatic respiratory viral infection.
Experimentally infected adult subjects with symptomatic HRV, RSV or influenza A infection can be distinguished from uninfected individuals by a distinct group of genes (“factor”) demonstrating differential expression among symptomatic individuals as compared to asymptomatic individuals. For each viral challenge, peripheral blood was drawn for whole blood gene expression analysis at scheduled time points post intranasal inoculation of virus. Whole blood gene expression was determined pre-inoculation (baseline), at time of peak symptoms for each symptomatic individual and a matched timepoint for each asymptomatic individual. A) Heat map representing gene expression for genes contained in Factor 16. Columns represent subjects and correspond to points in Figure 1B, with the first 10 columns representing baseline gene expression of asymptomatic individuals in the HRV challenge, the next 10 columns representing timepoints matched to peak symptoms for the asymptomatic subjects in the HRV cohort and the following 10 columns representing time of peak symptoms for the 10 subjects who developed symptomatic HRV infection. A similar layout continues for the RSV and influenza cohorts. Blue and red represent extremes of gene expression, with visually apparent differences between baseline and matched timepoints in the asymptomatic individuals versus time of peak symptoms in symptomatic individuals. The initial models were built without label information for each subject (asymptomatic versus symptomatic, baseline timepoint versus infected/matched timepoint). This design allowed for the model to cluster individuals based on expression patterns alone, thus minimizing bias in factor organization. Bars underneath represent individual groups (black = baseline, red = asymptomatic, blue = symptomatic). P-value (ANOVA) for the difference in factor scores between symptomatic and asymptomatic subjects at time T for the combined dataset is < 1×10⁻¹⁶; for rhinovirus 2.5 × 10⁻⁵, for RSV is 2.3 × 10⁻⁷ and for influenza is 5.0 × 10⁻¹³). B) Factor plots representing categorization of asymptomatic and symptomatic subjects at baseline (black), matched timepoint to peak symptoms (asymptomatic, red) and peak symptoms (symptomatic, blue). C) Leave-one-out cross validation correctly identifies 97% of individuals with viral infection versus no infection (3/84 misclassified). Pd = probability of detection; Pf = probability of false discovery.

