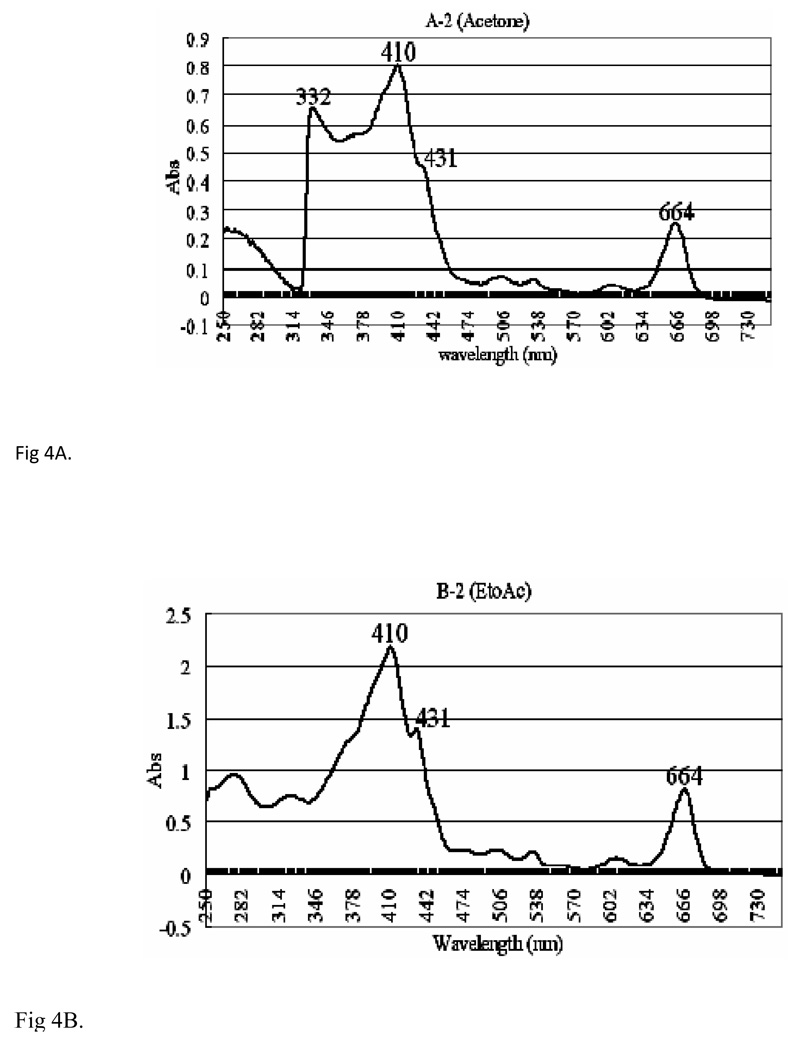
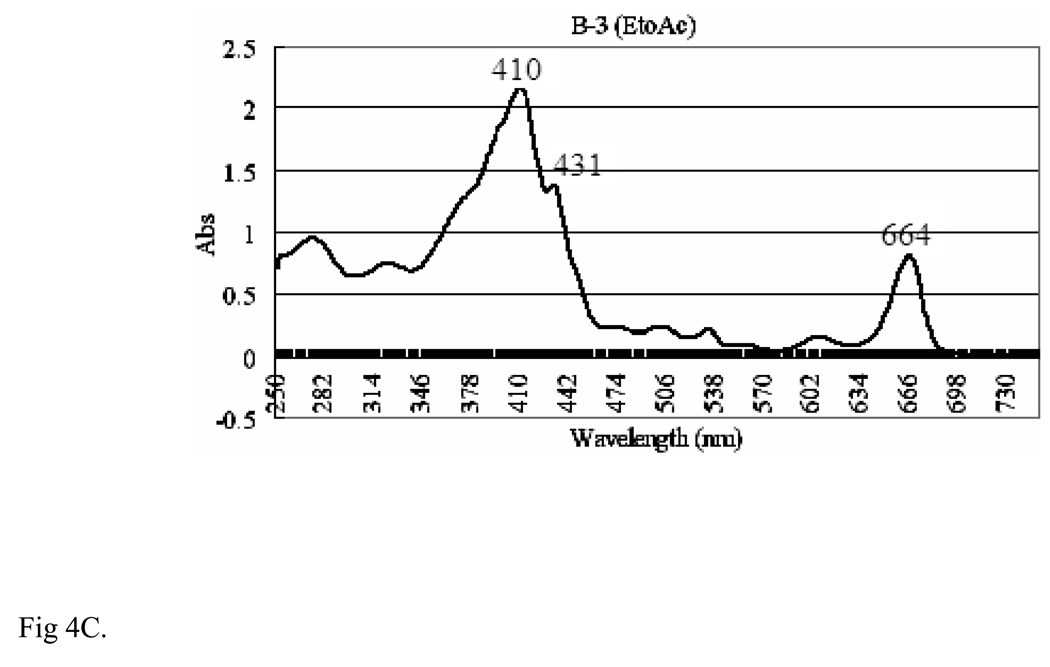
Fig. 4.
The UV Spectra of Multiple-Solvent fractions of V. amygdalina Extracts [A] Ultraviolet (UV) spectrum of fraction A2 of VA extracts, showing distinct peaks at 410,431,664 and 332 nm at absorbencies of 0.8, 0.45, 0.25 and 0.65 respectively. The extracts were UV detected from 250 nm–730 nm on Varian UV-Visible spectrophotometer (CARY 300 BIO). Reference solvent used was acetone. [B] UV spectrum of fraction B2 of VA extracts, showing distinct peaks at 410, 431 and 664 nm at absorbencies of 2.25, 1.48 and 0.75 respectively. The extracts were UV detected from 250 nm–730 nm on Varian UV-Visible spectrophotometer (CARY 300 BIO). Reference solvent used was ethyl acetate. [C] UV spectrum of fraction B-3 of VA extract, showing distinct peaks at 664 nm, 410 nm and 431nm at absorbencies of 2.25, 1.48 and 0.75 respectively. The extracts were UV detected from 250 nm–730 nm on Varian UV-Visible spectrophotometer (CARY 300 BIO). Reference solvent used was ethyl acetate.


