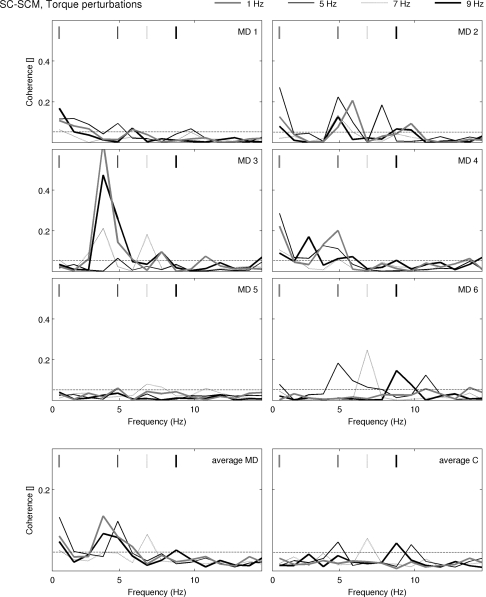
Fig. 3.
SC-SCM coherence spectra in the torque protocol, for the four different torque perturbations (1, 5, 7 and 9 Hz). In each figure, the bottom horizontal line is the 95% confidence limit; the upper vertical lines represent the frequency where the WM applied perturbation. For each MD patient, spectra are presented in the top six figures. Averaged spectra are also presented for MD patients and for Control subjects (bottom 2 figures). SC splenius capitis, SCM sternocleido mastoid

