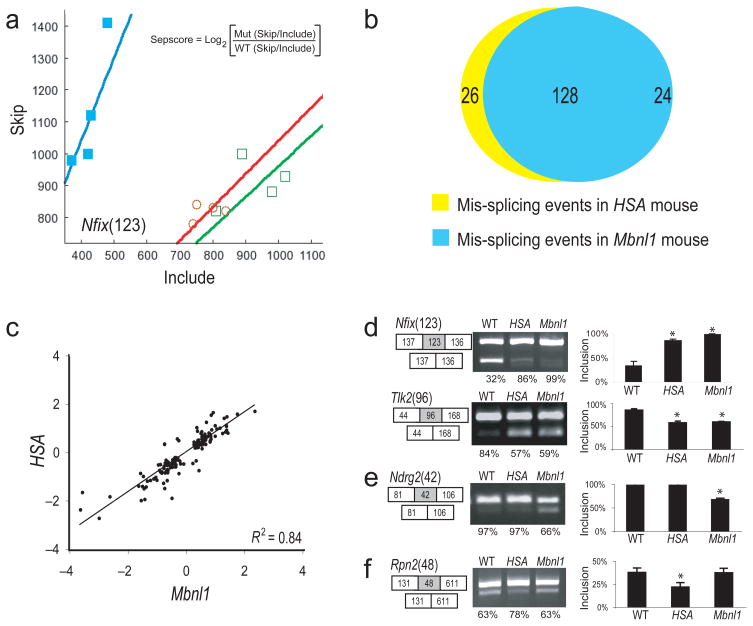
Figure 1.
Comparison of splicing perturbation in the two mouse models. (a) Plot of skip/include ratio array data for an exon from Nfix in wt (filled squares), HSALR (open circles) and Mbnl1ΔE3/ΔE3 (open squares) mice (n = 4). Separation score is the log2 ratio of skipping probe set intensity versus include probe set intensity in a mutant relative to wild-type (see inset, also see Methods). (b) Diagram showing numbers of aberrant splicing events in HSALR mice and Mbnl1ΔE3/ΔE3 mice with |sepscore| ≥ 0.3. (c) Correlation of sepscore values for aberrant splicing in HSALR compared to Mbnl1ΔE3/ΔE3 mice (Pearson R2 = 0.84). (d–f) Validation of members from different classes of events by RT-PCR. (d) Exons either up (Nfix) or down (Tlk) regulated in both HSALR and Mbnl1ΔE3/ΔE3 mice, (e) an exon only affected in Mbnl1ΔE3/ΔE3 mice, or (f) only affected in HSALR mice. The numbers in parentheses represent the length in nt of the affected exon (gray box), shown with flanking exons (white boxes). The RT-PCR products from three individual mice were quantified using the Bioanalyzer, and inclusion rates were calculated. Samples were judged as different from wild type if a t-test indicated that the sample was unlikely to be from the wild type distribution with p < 0.05 (asterisks).

